Architect// research
← all research← back to site
·5 min read

Advertised APR is not a measurement

Two well-known data providers reported the fee yield of the same liquidity pool, on the same day, as roughly 8% and roughly 326%. Neither was lying. This is what we learned from deciding to stop trusting either one and measure the chain ourselves.

Advertised APR is not a measurement

The number that started it

In July 2026 we were picking pools and needed to know what they actually pay. For one WETH/USDC pool on Base, DefiLlama reported a base yield of around 8 to 9 percent. GeckoTerminal, deriving from daily volume, gave a mean of about 326 percent, a median near 281, and peaks past 1000.

A factor of roughly 38, for the same pool, on the same day. Both providers agreed on the pool's size, so they were looking at the same thing. The gap is in what each one counts and over what window: one smooths over weeks, the other extrapolates from volume that includes arbitrage and MEV flow that does not translate into capturable fees one-for-one.

We hit the same problem on a second pool. GeckoTerminal said 190 percent, DefiLlama said somewhere between 34 and 70, and when we measured on-chain we got about 14. Two independent on-chain methods agreed with each other and disagreed with everybody else.
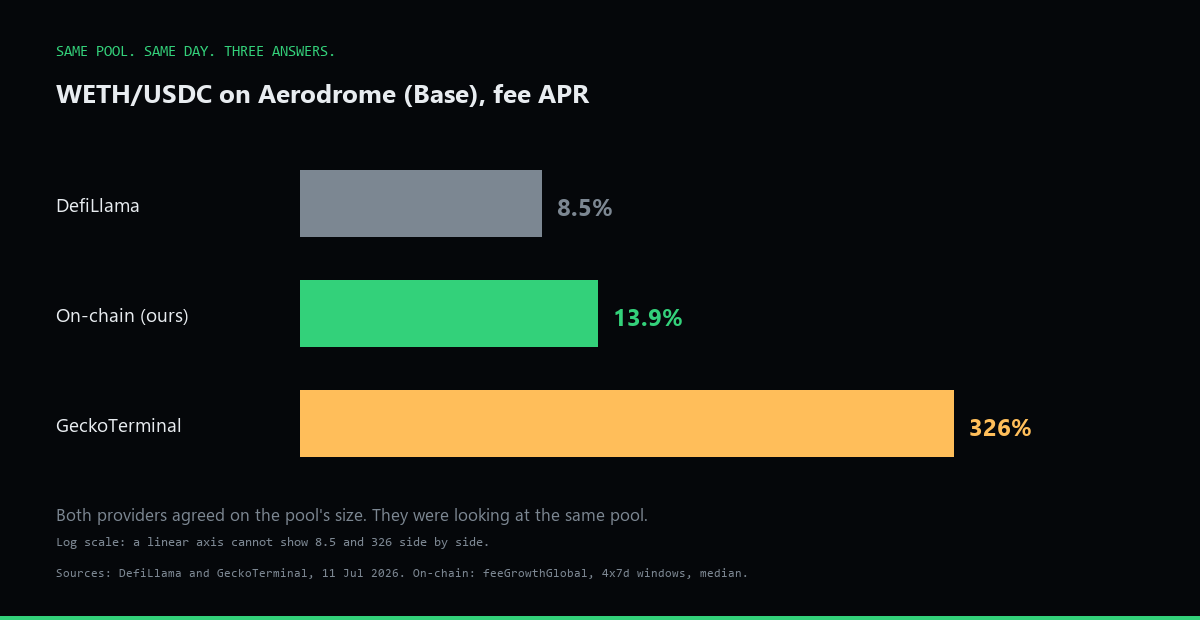
Bar chart comparing three fee APR figures for the same WETH/USDC pool on Aerodrome on the same day: DefiLlama 8.5 percent, our on-chain measurement 13.9 percent, GeckoTerminal 326 percent, on a logarithmic scale.
The same pool, the same day, three answers. Log scale: a linear axis cannot show 8.5 and 326 side by side.

Why volume times fee does not work

The obvious way to estimate fee income is volume multiplied by the fee rate. On Aerodrome that method is broken, and not subtly.

The fee rate is dynamic. We queried the same pool contract minutes apart and read 30 basis points on one call and 270 on another, a factor of nine within minutes. Multiply the day's volume by whichever number you happened to read and you get anything between 11 percent and 100 percent for the same pool on the same day. Any figure derived this way is a coin flip dressed as a metric.

What we measure instead

Every concentrated liquidity pool keeps a running accumulator of the fees it has ever charged. Reading it at two blocks a week apart and taking the difference gives the fees genuinely charged in that period, whatever the rate happened to be at each individual swap. It integrates reality instead of estimating it.

We divide that by the pool's liquidity, annualise over the real elapsed time between the two blocks, and repeat across four consecutive weekly windows. The published figure is the median of the four, with the lowest and highest kept alongside as an error bar. No aggregator is involved at any point.

One honest caveat about what the number is: it represents the swap fee yield of unstaked liquidity. On Aerodrome, staked liquidity sends its fees to the gauge instead, and token emissions are an entirely separate stream. Conflating emissions with fees is its own trap, and we fell into it early: yields of 62 to 84 percent we were seeing on real positions turned out to be emissions, not fees at all.

What 906 measurements showed

We have been measuring 25 pool contracts across Base and Arbitrum several times a day. As of early August that is 906 measurements over 12 days. When we compared the numbers we had configured, taken from aggregators, against our own medians, we corrected sixteen of them.

A pool we had at 34 percent measured 13.4. One we had at 7.65 percent measured 1.5. In every case the configured figure was too optimistic, never too conservative.

The worst offender is the one worth pausing on. The five-fold error was on a stablecoin pair, the kind of pool where an LP expects the fewest surprises and does the least checking. It was the least exciting pool on the list and the most wrong.

Eleven days later, with series four times longer, those medians have held to within about ten percent.

Sometimes there is no single number

Measuring properly also revealed something a single headline figure hides. For six of the 25 pools, the highest of the four weekly windows is at least double the lowest. For those pools, a fee APR is an order of magnitude, not a measurement, and anyone quoting one to two decimal places is quoting noise.

Even a well-behaved pool moves. Our most-measured pool read 12.5 percent as its median on a single day, with the four windows spread between 10.3 and 15.9. That is the honest shape of the data. It is also why we feed our strategies a rolling median across many measurements rather than the latest reading, and why pools whose data is too unstable to model are shown as unknown rather than given a comforting number.

What this does and does not mean

None of this means the aggregators are useless or dishonest. They answer a different question, over different windows, at a scale that no individual protocol can match. We still use one of them to discover which pools exist. We just never let it decide anything: the API discovers, the chain decides.

And our own numbers are not truth either. Twelve days is a short series, a median can be pulled by a regime change, and none of this predicts what a pool will pay next month. What measuring buys is narrower than it sounds and more useful than an estimate: we know what a pool actually paid, rather than what somebody modelled it as paying.

The practical advice, if you provide liquidity anywhere: before committing capital on the strength of a displayed APR, find out whether that number was measured or estimated, over what window, and whether it includes token emissions. The answer changes the number by more than most people expect.

Read more research/methodology